Erudite articles for Fundamental and -Technical analysis.
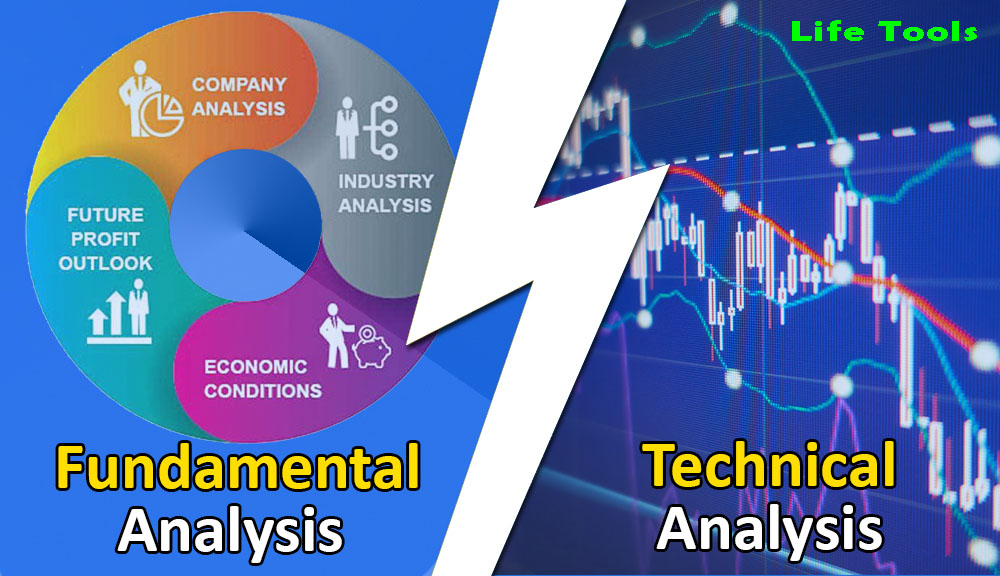
1.Fundamental analysis
Fundamental Analysis is a market analysis of Forex through which the currency of a country can be traded efficiently by understanding the economic situation of different countries.
Fundamental Analysis provides information on how a country's political and economic situation or events affect the Forex market. Statements made by economists or political leaders can have a huge impact on the Forex market. However, considering the importance, some sites such as (Daily FX, Forex Factory, Forex Pros) rate each economic news. Such as: High Impact, Medium Impact, Low Impact.
The Biggest Fundamental News for America and Its Impact for the Forex Market Let’s Know About Non-Farm Payroll (NFP)?

The Biggest Fundamental News for United States of America and Its Impact for the Forex Market Let's Know About Non-Farm Payroll (NFP)? What effect can this have on the forex market?
Non Farm Payroll (NFP) means searched by US BUREO OF LABOR STATISTICS
A written report where a list of the total paid workers in the US. However, the following sectors were excluded in the report.
Ordinary government employees
Housekeeper working at home
Non-profit organizations working
Workers engaged in agricultural work
When Non Farm Payroll (NFP) is published
Non Farm Payroll (NFP) accounts for 80% of total workers. Who play a major role in GDP. Non Farm Payroll (NFP) is published on the first Friday of every month. This report plays a role in the adoption of government action, economists assess the country's economic situation. It also helps in adopting the next policy.
Aug 6, 2021 Friday 6:30pm
The dollar is in a much better position due to the fact that it is actual better from the forecast……
Non-Farm Employment Change:—-Actual————–Forecast——————-Previous
943K —————-870K———————938k
The Four Cast value of Non Farm Payroll (NFP) is 90K and this month's value was Actual 943K and Forecast 870K. Now the actual value is higher than the fourcast value, then the dollar is stronger. If it is less, the dollar will be weaker. Report was published on 08/09/2021 Bangladesh time 6.30pm. The news was released, the market went crazy. At the same time there can be 100 pip movement. But EUR / USD does not always move with the release of NFP news. It can also turn in the opposite direction for a while. We can trade EUR / USD according to the result of the news 1/2 hour after the news release. The actual value higher than  the EUR / USD sale.If the actual value less than the fourcast will be EUR / USD bye. Those whose balance is between 100 and 1000 do not trade at the time of NFP news release.
Those whose balance is above 1000 can be traded by looking at their actual. There is no need to trade if we do not understand the impact.
Economic calendar:-
Date – Time – Currency – Data Released – Actual – Forecast – Previous

Economists create these economic calendars.
If the dollar-related news forecast is better than the previous value, then the dollar will be stronger against other currencies. But when the news is out, the trader must check the actual data.
Whose statement should be followed?
Chairman of the Federal Reserve Bank of the USA, Secretary of the Treasury, President of the Federal Reserve Bank of San Francisco, ECB President and others.
Market movement is usually in the news?

Interest rate
Traditionally, if a country raises its interest rate, then the currency is stronger now because investors will invest in that country in the hope of making more profit.
Employment Situation
If the pearl employment goes down, you will understand that this is a sign of their weak economy. This is why the interest rate is also affected. This news has a negative effect on the currency.
Trade balance, budget, treasury budget
If a country's budget deficit is high, it can affect the country's currency.
Gross Domestic Product or GDP
GDP is published once every 4 months and it initially indicates the strength of the currency. Higher GDP numbers create higher interest rate fields.
There are also retail sales, durable goods, personal income, personal spending, core PCE prices and many more that can impact the news market.
2. Technical analysis ?
TECHNICAL ANALYSIS Since we trade through a software (which I wrote earlier) called MetaTrader 4 or MT4 and MT5. Chart can be seen step by step from 1 minute to 1 month and if necessary can be easily seen before the launch of the software for analysis , the charts are 1 / bar chart, 2 / candlestick chart, 3 / line chart, There are hundreds of indicators including in the software for analysis with famous mathematician Fibonacci ,I will write about the specific indicators in the external way Stay tuned.
Chart 3 looks like a picture.

A notable aspect of technical analysis is the trend line. If its image can be drawn correctly then it will work better than any other method. If the trend line drawing is not correct then it will be wrong to trade and for wrong trade you will lose money sure, So forex cannot be do wrong, forex must take every step correctly and at the right time, you cannot do anything without being 99% sure it's relationship of money .
What are the trends and how many types of trends?
The trends is the movement of the market .
3 types of trends.
1.Up trend
2.Down trend
3.Sideway trend
The up trend starts from below the support area and the down trend starts from above the resistance.
Support and resistance :-

Technical analysis
A notable aspect of technical analysis is the trend line. It works better than any other method if its image is drawn correctly. Usually you have to draw a trend line to understand the up trend and down trend. Almost most traders can't figure it out just like that. And even if you draw, the trend and the opposite image leaves it. The main thing is that the up trend starts from the bottom of the support area and the down trend starts from the resistance.
Below is how to draw the trend line correctly.
3 types of trends.
1. Up trend
2. Down trend
3.  Sideway trend
Some important tips
To draw the perfect trend line, you have to have a minimum of 2 heads above or below and 3 to confirm.
Drawing with support and resistance levels makes the trend line more perfect.
If a trend line is intentionally turned in any direction, it will not be a valid line.
The New York Summer Session starts at 7 pm Bangladesh time and ends at 3 pm. When winter comes, the session will start at 6 pm Bangladesh time and will end at 4 pm. What we know about New York City is that this city never sleeps. The session starts when everyone joins the office work.
Below are some tips for trading in this session.
There is a lot of liquidity (conversion into cash) in this market at the beginning of the morning session. And it overlaps with the European session in the Forex market.
More economic reports are released in the New York session. Since the dollar is involved in 75% of trades, when the U.S. economic data is released, the movement of the market goes out at a massive rate.
When the European market is closed, the vitality of the Forex market decreases a bit. Which also continues in the U.S. afternoon session.
There is very little movement in the Friday afternoon session. Because traders are busy with entertainment activities like football matches, bars, nightclubs etc. on that day.
There is a possibility of some market catastrophe in Friday session. Because U.S. traders close all their trades ahead of the weekend. They wait for the financial news. Trying to take advantage of that on Monday.
As everyone waits for the release of U.S. financial data, the value of the dollar may rise or fall this session.
There are numerous indicators on the MT4 platform for technical analysis. There are some of the most popular indicators. I will write them step by step. One of them is RSI. What is it?
Indicates what is used alone.
What is RSI?
RSI IS THE RELATIVE-STRENGTH-INDEX
It indicates more buying (overbought) more selling (oversold) in the market
In general, we understand that when the price of a product goes up abnormally, it is likely to go down,
In the same way, if the price of a product falls abnormally, it is likely to rise again,
 RSI in general indicates that when the market rises to 70%, it indicates that the market is overbought, now the possibility of selling is created.
In the same way, when the price of a product falls abnormally by 30%, it indicates that the market is oversold and now there is a possibility of buying.
It looks like the picture below
